The sedimentation velocity, together with the geometric grain size, allows the determination of the grain density or shape, even in distributions.
ADVANCED SAND SEDIMENTATION ANALYZER (Article)
Updated 11-Sep-11 15:24h
|
ABSTRACT: Sedimentation velocity of a single grain is the most accurate measure of grain size. The advanced settling tube system extends this accuracy to particle collectives and thus provides a powerful tool for sand sedimentology. The author's advanced settling tube system, MacroGranometer™, adds operational and maintenance ease, and variety of results.
Distributions of fine particles obeying Stokes', i.e. viscous, sedimentation (Reynolds' number Re <0.1) does not allow much sedimentological interpretation for the following reasons:
Sand-sized particles, in contrast, are sensitive to source and transportation influences. Therefore, the size and sedimentation velocity distributions of sand-sized particles do reflect the source and transportation influences.
The size of a single grain can be determined most accurately by its sedimentation velocity, controlled by mass, volume and shape of the grain. Sieve and optical measures are one-level dimensions.
Non-sphericity, particularly flatness, decreases the sedimentation size but increases the sieve size. This is why flatness causes that the specific surface and related properties are calculated from sieving as smaller, instead of as being larger when derived from sedimentation. Therefore, the sedimentational grain size is influenced by grain shape consistent with the grain specific surface. Whereas other settling tubes are using sedimentation formulas for spherical grains only, the author's MacroGranometer™ is based on the author's formulas, which enable to choose a more realistic particle shape (SF = 0.65 is standard).
Settling rate of a coarse irregular grain is invariably given, as the non-viscous drag of water keeps it in a defined position. Sieve results include random error due to changing grain position, limited grain access to sieve holes, their blocking, large sieve intervals etc.. Thus sieving requires large samples to "absorb" the random error and to provide a sufficient sample representatives. Nevertheless, from non-sedimentation methods, precision wet sieving using circular holes and a sieving time proportional to the grain number per hole of each sieve provides the best standard definition of a geometric grain size.
The sedimentation grain size is surely the
"natural" quantity related to the origin of sediments and sedimentary rocks.
However, sedimentary origin is no excuse for analysis distortions by ordinary settling
tubes. These distortions do not mimic natural processes but seriously mask the proper ones
to be found and quantified by sedimentological interpretation. Until today, the
paraphrase of W. Shakespeare by R. L.
Folk (1962) is valid: "The fault, dear Friends,
lies not in the sands, but in your tubes, that they are skewing things."
The sedimentation velocity, together with the
geometric grain size, allows the determination of the grain density or shape, even in
distributions.
![]()
In groups, particles must be allowed to sediment at mutual distances such that their settling velocities become close to those of single particles. Sedimentation of coarse (sand-sized) grains in water generates forces which liberate the grains from each other: these forces surpass the water viscosity as the particle Reynol ds' number is greater than about 0.1. Therefore, the group of coarse grains does not need to be homogenized for sedimentation, but can be introduced at the top of a particle-free fluid. Particles become distributed vertically according to their settling velocity, which is identical for particles in each level: so called stratified suspension (H. J. Skidmore, 1948, ref. 69; John S. McNown and Pin-Nam Lin, 1952, ref. 67) develops, and stratified sedimentation takes place.
Stratified sedimentation enjoys a fundamental accuracy advantage over homogeneous sedimentation. First, the sedimentation length of all particles is known in a stratified suspension. In homogeneous suspension, the sedimentation length is known only for the topmost particles at the beginning of sedimentation; other particles interfere with them and their weight must be eliminated mathematically by taking a derivative. Secondly, the particle concentration (and thus the particle interference) rapidly decreases in expanding volume of stratified suspension, but it increases in the shrinking volume of homogeneous suspension.
This advantage of a stratified sedimentation of sand-sized particles, together with speed and price, explains the success of ordinary settling tubes, although some of them, such as the Emery's settling tube (Kenneth O. Emery, 1938, ref. 64), are exceedingly primitive.
Theoretical Stratified Sedimentation
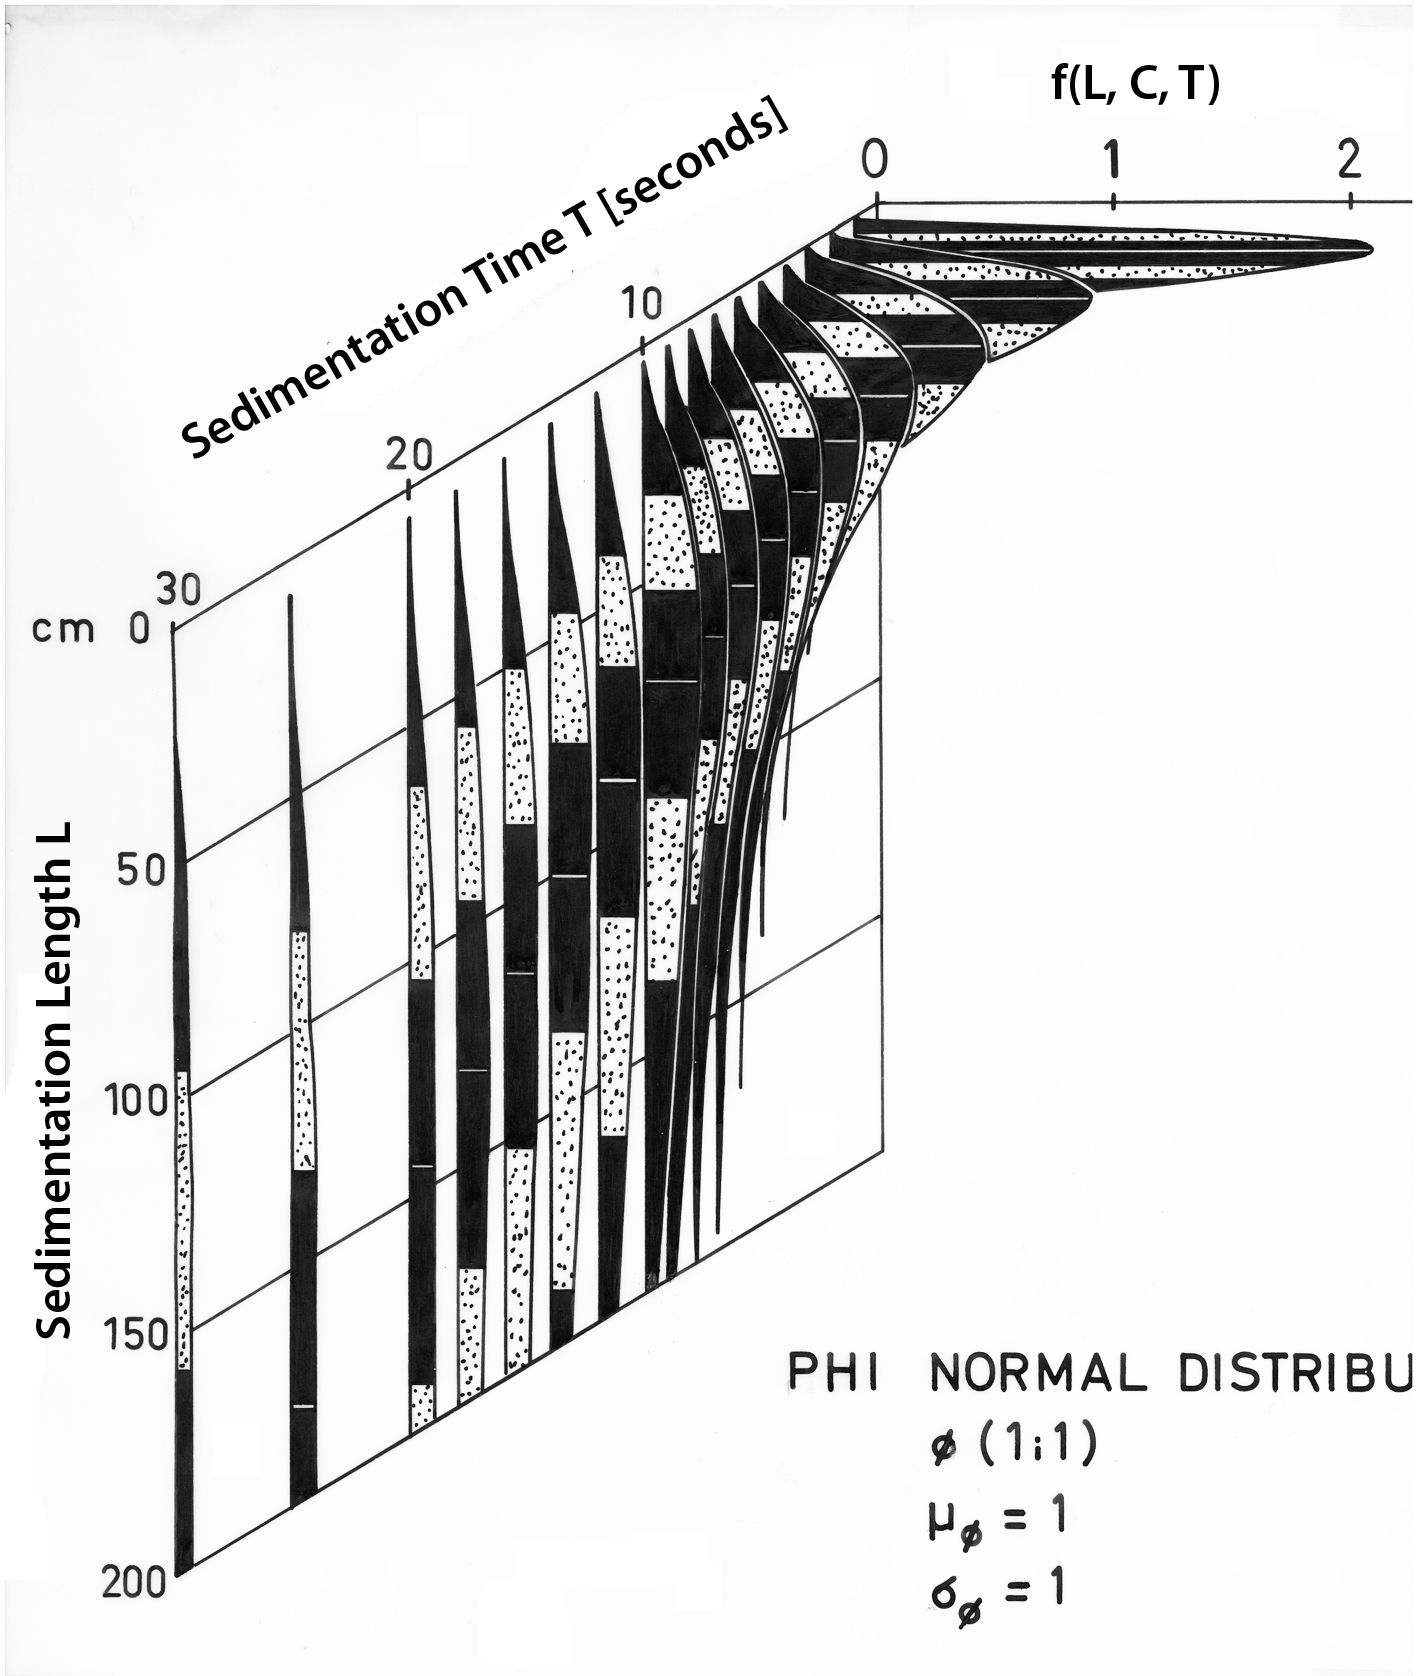
A theoretical settling rate frequency distribution during stratified sedimentation of a sand is shown in a three-dimensional diagram (Fig. 1, J. Brezina, 1970, ref. 41). The sand has a normal phi (Ø) -size distribution with both the mean size and the standard deviation equal to 1 Ø, written in the standard format Ø (m, σ). The two parameters of the normal distribution m = mean and σ = standard deviation are both one, in the given case Ø (1, 1). The vertical axis is the sedimentation length L, the horizontal axis shows the frequency which is proportional to particle concentration and suspension density. The diagonal axis is sedimentation time T so that the sedimentation length at each sedimentation time instant corresponds to the sedimentation velocity. After the sand is released to sedimentation, its sedimentation velocity distribution is shown at various sedimentation time instants.
Hydrodynamic Instability in a Stratified Suspension
The suspension density is strongest at the top when the sample is released: this is why a stratified suspension sedimenting in a clean fluid is hydrodynamically unstable at the beginning. Its lower portion up to its center with the maximum grain concentration has a negative density gradient, i.e., each overlaying layer has a higher density than the layer (or clean fluid) below, until the maximum concentration layer has settled (Fig. 1). The upper heavy fluid overlaying a light fluid, may form density convection. Due to the continuity principle, rising currents of lighter fluid replace the same volume of the sinking heavier suspension. Various types of density streaming due to hydrodynamic instability (known as Rayleigh-Taylor and Kelvin-Helmholtz instabilities, CHANDRASEKHAR, 1961) have been studied using mathematical models in the Los Alamos Scientific Laboratory, New Mexico (Bart J. DALY & William E. PRACHT, 1968; Bart J. DALY 1967, 1969; R. E. DUFF, Francis H. HARLOW & C. W. HIRT, 1962).
Ordinary Settling Tubes coarsen, diffuse, positively skew etc. the PSI and PHI distributions
A low sensitivity of sedimentation sensors of ordinary settling tubes requires too high particle concentration, producing serious distortions which can hardly be estimated and compensated for, since they also depend on the unknown sample. Specifically, these distortions damage the reputation of the theoretically perfect stratified sedimentation mainly in three ways:
Large samples (introduced without any homogenization) disturb the stratified suspension by causing strong streaming with periodic expansion and slowing down. The bottom of the suspension cloud expands downwards in proportion to the density gradient which first decreases due to mixing with water and later increases from particles accumulating on the bottom of the suspension cloud. The following stages of the expanding cloud develop as a rule:
Narrow settling tubes (with a diameter less than
15 cm) may reduce the streaming of large samples (coarse particles), but wall effects
delay some particles making the distortions more complex.
![]()
Advanced Settling Tube System - MacroGranometer™
The Advanced Settling Tube System virtually eliminates the distortions of the ordinary settling tubes. It approaches the highest theoretical accuracy of sedimentation of sand-sized particles in water.
The advanced settling tubes surpass all other methods of size distribution analysis, such as:
Only the advanced settling tubes feature the high resolution sediment weighing combined with a high resolution PSI-sedimentation velocity (PHI-grain size) resolution. Only the advanced settling tube system enables that the classical sedimentological interpretations become reliable and new solutions are possible. They make the efforts meaningful.
The effectivity and importance of the features listed below have been tested and confirmed on various MacroGranometer™ versions - the author's Advanced Settling Tube System.
The author calls his product MacroGranometer™, a size analyzer of coarse grains, in contrast to his early MicroGranometer™, a size analyzer of fine particles. Both instruments take advantage of the stratified sedimentation. Whereas the sedimentation of sand-sized particles can be maintained stable by using the smallest sample size, the sedimentation of finer particles is much more affected by sample size: a maximum of 20,000 particles finer than 50 µm would require only microgram sample size (see below). Therefore, the author's MicroGranometer™ stabilized the stratified sedimentation by a density gradient technique. The instrument permitted to analyze up to seven samples simultaneously. However, although the author was successful in the instrument design, he still discontinued a further MicroGranometer™ development because of the unreliable sedimentological interpretation even of the best distribution analyses of fine particles.
Instead, the author has focused his efforts onto the research and development of the MacroGranometer™, the sand sedimentation analyzer, in all related fields, such as mathematical statistics (theory of distributions), hydro-mechanics of sedimentation, mechanical engineering, instrument construction, and system analysis for computer solutions for three decades. Constructional (CAD), electronic and software solutions have been accomplished in cooperation with professionals.
The author has developed a series of hardware and software solutions in order to make particle concentration low enough and so keep the streaming influence negligible. From his studies on streaming in stratified suspensions, J. Brezina, 1970b (ref. 43) determined that the particles do not influence (drag down) each other when they are at a mutual distance greater than 3.5 mm, which means a limiting concentration of about 0.07% corresponding to suspension density 1.0012 (for 0.2 to 0.5 mm particles).
In addition to the particle
concentration lowering, the author (J. Brezina, 1971b, ref.
43)
suggested using a positively stratified fluid, i.e. with a positive vertical density
gradient (lighter fluid above the heavier one) to avoid the hydrodynamic instability. He
calculated a temperature distribution for the top of water column to compensate for the
opposite density gradient of a stratified suspension when using various sample sizes. The
author suggested an efficient streaming compensation: a slight heating of the top of the
water column in most critical cases, i.e. when small samples of fine material are used.
Temperature increase by a few degrees Celsius in the top few centimeters of the
sedimentation column reduces or eliminates a low
concentration streaming in the MacroGranometer™.
![]()
Reaching The Lowest Particle Concentration
Three solution groups reduce the particle concentration sufficiently:
The smallest sample size is limited by the sample representatives (about 15,000 to 20,000 grains, J. Brezina 1971b, ref. 43).
Suspension sensing, such as by pressure (piezometric or manometric methods, e.g. Woods Hole Rapid Sediment Analyzer), was tested, but rejected. Attempting to increase the accuracy by reducing the particle concentration decreases the measurement sensitivity. This handicap can not be compensated for by any advantage the suspension sensing offers, such as operational ease (sediment does not need to be removed) and low price.
This is why a sediment sensing (by weight) must be used. The author developed a compact underwater spring balance. The spring arrangement eliminates an asymmetric load moment (German patent 2,251,838 by J. Brezina, 1972b, ref. 46), its load displacement is extremely small: 0.1 mm per 10 gram of quartz underwater weight. Therefore, it is not only very sensitive (10 µg at a measuring range for 0.1 g quartz sample means a resolution of 0.01%) but also fast and robust (not vulnerable by handling).
The maximum significant sensitivity has been reached by:
| n | PSI | PSI + 0.02 |
| 78 | -5.00 | -4.98 |
| 157 | -4.00 | -3.98 |
| 314 | -3.00 | -2.98 |
| 628 | -2.00 | -1.98 |
| 1,256 | -1.00 | -0.98 |
| 2,513 | 0.00 | 0.02 |
| 5,026 | 1.00 | 1.02 |
| 10,051 | 2.00 | 2.02 |
| 20,102 | 3.00 | 3.02 |
Whereas the sedimentation column diameter must as
large as possible to allow space for the smallest particles concentration, it must be
smaller than the balance pan, leaving about 3 cm sediment-free margin on it (see the
particle trajectories above it on Fig. 3).
![]()
Because the balance pan with a diameter greater than 26 cm seriously slows the fast balance pan displacement, the sedimentation column diameter must be 20 cm.
C. Reduction of the initial grain concentration on the sedimentation column top
The maximum grain concentration occurs at the beginning of the stratified sedimentation. Its influence can be minimized by homogenization of the suspension during sample introduction. The author's Venetian blind generates about 1 cm thick suspension layer, and releases all particles. The concave lamellae rotate eccentrically (Fig. 2). The concavity radius is greater than the rotation radius: this is why the water inertia stream is focused onto the particles on each lamella and flushes them away. The lamellae keep vibrating in open (vertical) position until all particles pass them (about 3 seconds for finest particles to pass the 5 mm water layer above the lamellae).
Influence of environmental temperature change is reduced by the heat insulation and thickness of the sedimentation column.
Increased Speed of the Underwater Balance
A) Geometry and material of the moving parts of the underwater balance:
1 Reduction of the inertia by minimizing mass of the balance moving parts. The mass of the steel parts including one half of one pair double cross-leaf springs is 34.6 grams, the acrylic glass parts including the balance pan is 210.0 grams; the total mass of the moving parts is 244.6 grams. This is less than one quarter of the values for balances in the best other settling tubes.
2. Reduction of water inertia by minimizing cross-sectional area perpendicular to the load displacement: the balance pan occupies most the area. The pan diameter must exceed that of the suspension column by about 6 cm in order to catch all particles since their trajectories diverge few centimeters above the balance pan (Fig. 3). Therefore, the pan diameter seriously limits the column diameter. Extremely fast balance response (130 milliseconds for 90% of 1 gram load) makes the pan diameter of 26 cm (and thus the column diameter of 20 cm) possible. A larger pan diameter (and broader columns) would delay the weighing response and thus bias the particle size distribution.
B) Rapid measuring response of the electronics system (no weighing compensation by a feed back [compensation] method).
C) Sedimentation length: 180 cm
matches the overall system accuracy.
![]()
The construction of MacroGranometer™ is such that the client can repair or replace most defective parts himself. The hardware and software components feature modularity making the following operations easy:
A) Mechanical modules. Partial disassembly allows for a thorough cleaning and small repairs by client. A complete disassembly, performed by a medium skilled technician guided remotely by GranoMetry per telephone, fax, etc., allows for efficient maintenance, identification of the malfunction and defective part to be repaired, adjusted or sent to GranoMetry in special luggage. The major modules (and two covers of the sedimentation tube) are mutually connected by easily removable screws, and tighten against water leaks by PTFE (Teflon™) gaskets, so that each module can easily be detached:
B) Electronic module can be checked for functionality (fuses, power supply, carrier frequency measuring amplifier). Either the whole Electronic Module or its selected parts (power supply, carrier frequency measuring amplifier, or our printed circuit board) can be sent to GranoMetry for repair or exchange in a special luggage.
C) MacroGranometer™ Software for your DOS Personal Computer system. Typical solutions of problems include diagnosis and therapy.
1. Operation Software, GRM™
The GRM™ software controls the whole instrument operation. Together with the analysis results, the operator can record sample and analysis data. Other important data are recorded automatically, such as date, time, temperature on top and bottom of the sedimentation column, local gravity acceleration, and the GRM™ program version.
The measured analysis data is generated in our Standard Data File Format, presenting the optimum scheme for collecting of the maximum measured amount of data with minimum storage requirements: the PSI-logarithmic sedimentation velocity with a constant interval of 0.02 PSI was chosen as a universal mathematical interface for a flexible data processing.
![]()
Easy Operation, Variety of Results
2. Data Processing Software, SedVar™
Because the measured PSI sedimentation velocity distributions are valid for the laboratory terms only (fluid's viscosity and distilled water, temperature, and gravity acceleration), the MacroGranometer's™ data processing software SedVar™ converts these measured laboratory PSI-sedimentation velocity distributions into those of the following variables:
Distributions of other variables than those of the PSI-sedimentation velocity and of the PHI-grain size, such as those of Reynolds' number (laboratory, standard, and local), grain density, grain shape, may be suitable for certain applications.
![]()
Retaining the geometric grade scale of J. A. Udden (1898), W. C. Krumbein (1934) introduced binary logarithm of grain size, PHI (transcription of the Greek letter Ø). This notation became popular among geologists because it makes calculations and mathematical expressions easy.
Similarly, G. V. Middleton (1967) applied the binary logarithm to sedimentation velocity, and defined PSI (transcription of the Greek letter ).
The pertinent relations are as follows:
PHI = -log2Xi
Xi = 2-PHI
PSI = -log2Yi
Yi = 2-PSI
Explanation:
X1 is a dimensionless ratio of a given grain size, di, in millimeter, to the standard grain size of 1 millimeter, d0 (D. A. McManus, 1963, W. C. Krumbein, 1964):
Xi = d1/d0
Yi is a dimensionless ratio of a given sedimentation velocity, vi, in centimeter per second, to the standard sedimentation velocity of 1 centimeter per second, v0:
Yi = v1/v0
Shape Factor (J. Brezina, 1979b)
From various definitions of grain shape, the simple flatness characteristics, the ratio of the grain height to its average perpendicular dimension, is the hydrodynamically most effective one (A. T. Corey, 1949, and independently McNown & Malaika, 1950). This dimensionless ratio number relates the minimum, medium and maximum mutually perpendicular grain dimensions, a, b, c respectively:
SF = a/(b*c)0.5
The SF value for isometric shape, such as cube (with its plane normal to the direction of motion), is, by theory, the same as for the smooth sphere, i. e.
SFiso = 1.0.
However, the hydrodynamic roughness of the isometric particles causes their drag coefficient greater than that of the smooth spheres. This results into the higher SF value for spheres than is mathematically possible. The author calls the Shape Factor resulting from the drag coefficient the Hydraulic Shape Factor, SF' (J. Brezina, 1979b, p. 2 - 3). In order to retain his drag coefficient equation (J. Brezina, 1979b, p. 5) valid for geometric SF, he adjusted the equation parameters such that the smooth spheres with SF' value 1.18 correspond to the smaller drag coefficient:
SF'sph = 1.18.
The author has not studied the influence of roughness on drag coefficient of grains with lower SF values. However, he assumes that the grain smoothness may increase SF' by a value lower than 0.2, similar to the smoothing isometric grains into spheres.
The naturally worn irregular grains have the shape factor values in the relatively narrow range of (Byrnon C. Colby + Russell P. Christensen, 1957; E. F. Schulz, R. H. Wilde, & M. L. Albertson, 1954)
SF'irr = 0.65 ± 0.05.
However, most authors take the grain shape of the smooth sphere as a reference shape, irrespective which shape the grains really have. This is in conflict with the reality excused only by the unavailability (and difficulty) of grain shape measurement. This is as if a 'physicist says about the horse: let's assume it is a sphere!' (J. Brezina, 1992, p. 166; Miroslaw Jonasz, 1991, p. 147). Taking the smooth sphere instead of the rotational ellipsoid with SF' = 0.65 as reference causes enormous size reduction of the irregular grains (J. Brezina, 1979b, p. 2).
You are visitor number
since July 17, 2000
![]()